Correlation and Regression
Formative Activity
Covariance Pearson Correlation
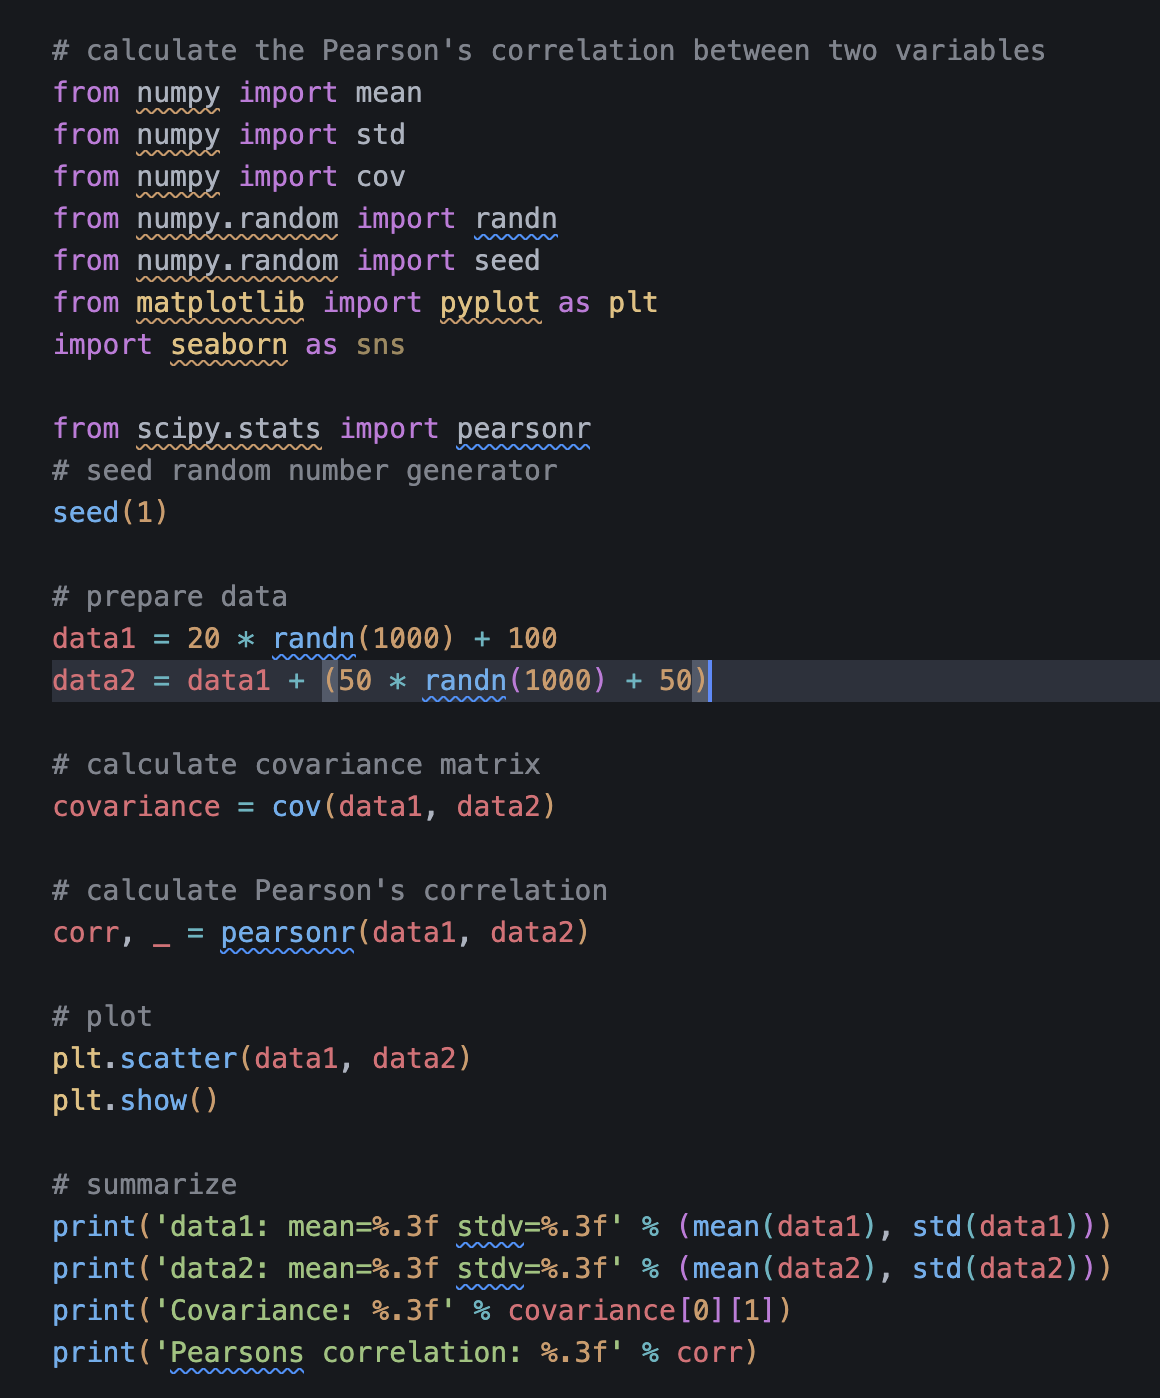
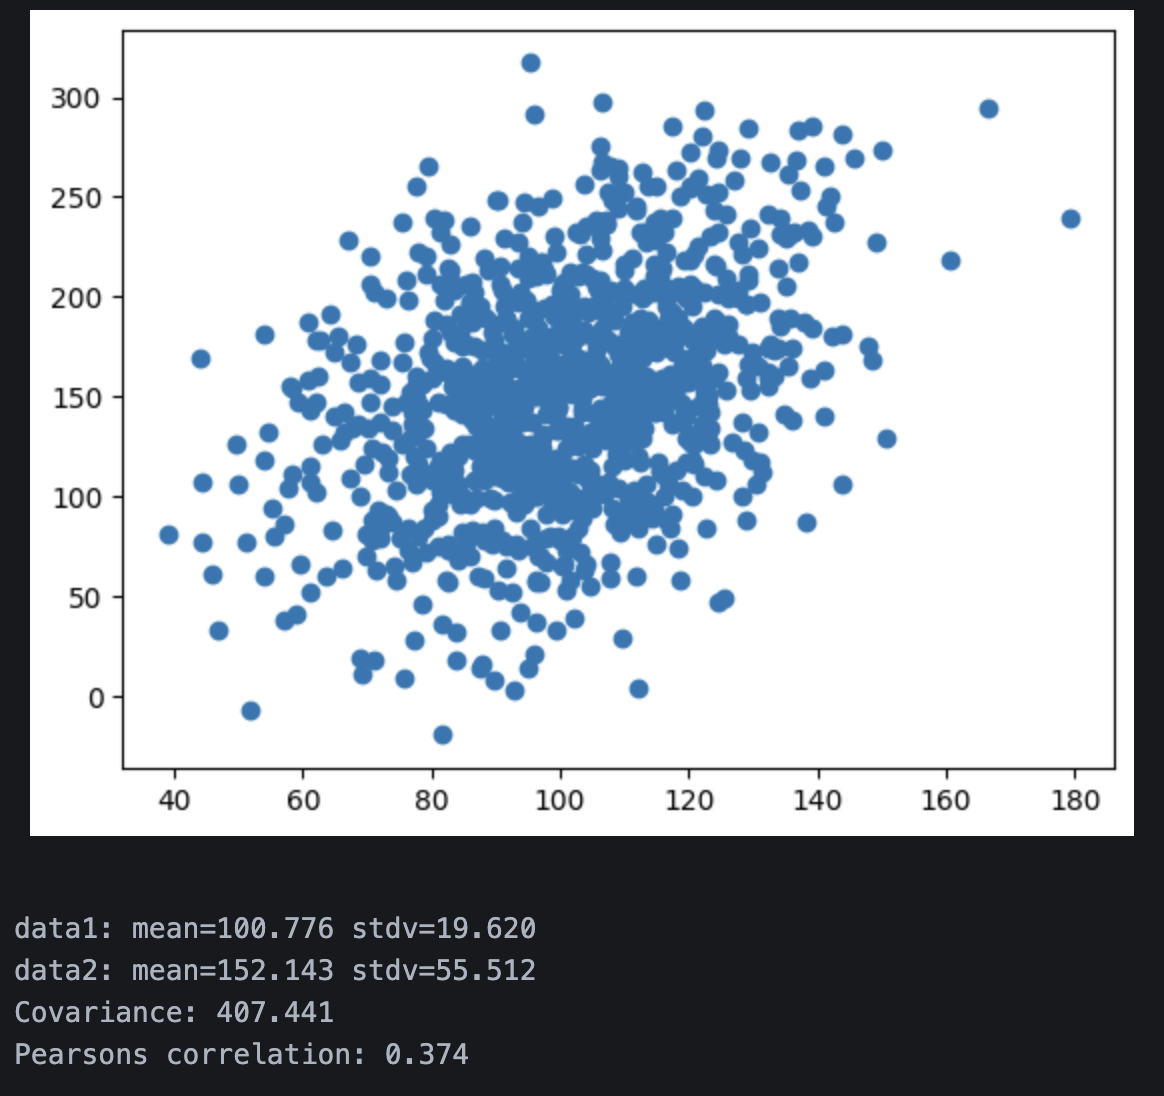
In order to observe how changes in data points impact correlation, I have manipulated data1 by adding a higher standard deviation of + 50, which shifts all values upward. This change will result in a lower Pearson correlation, since data2 becomes less dependent on data1.
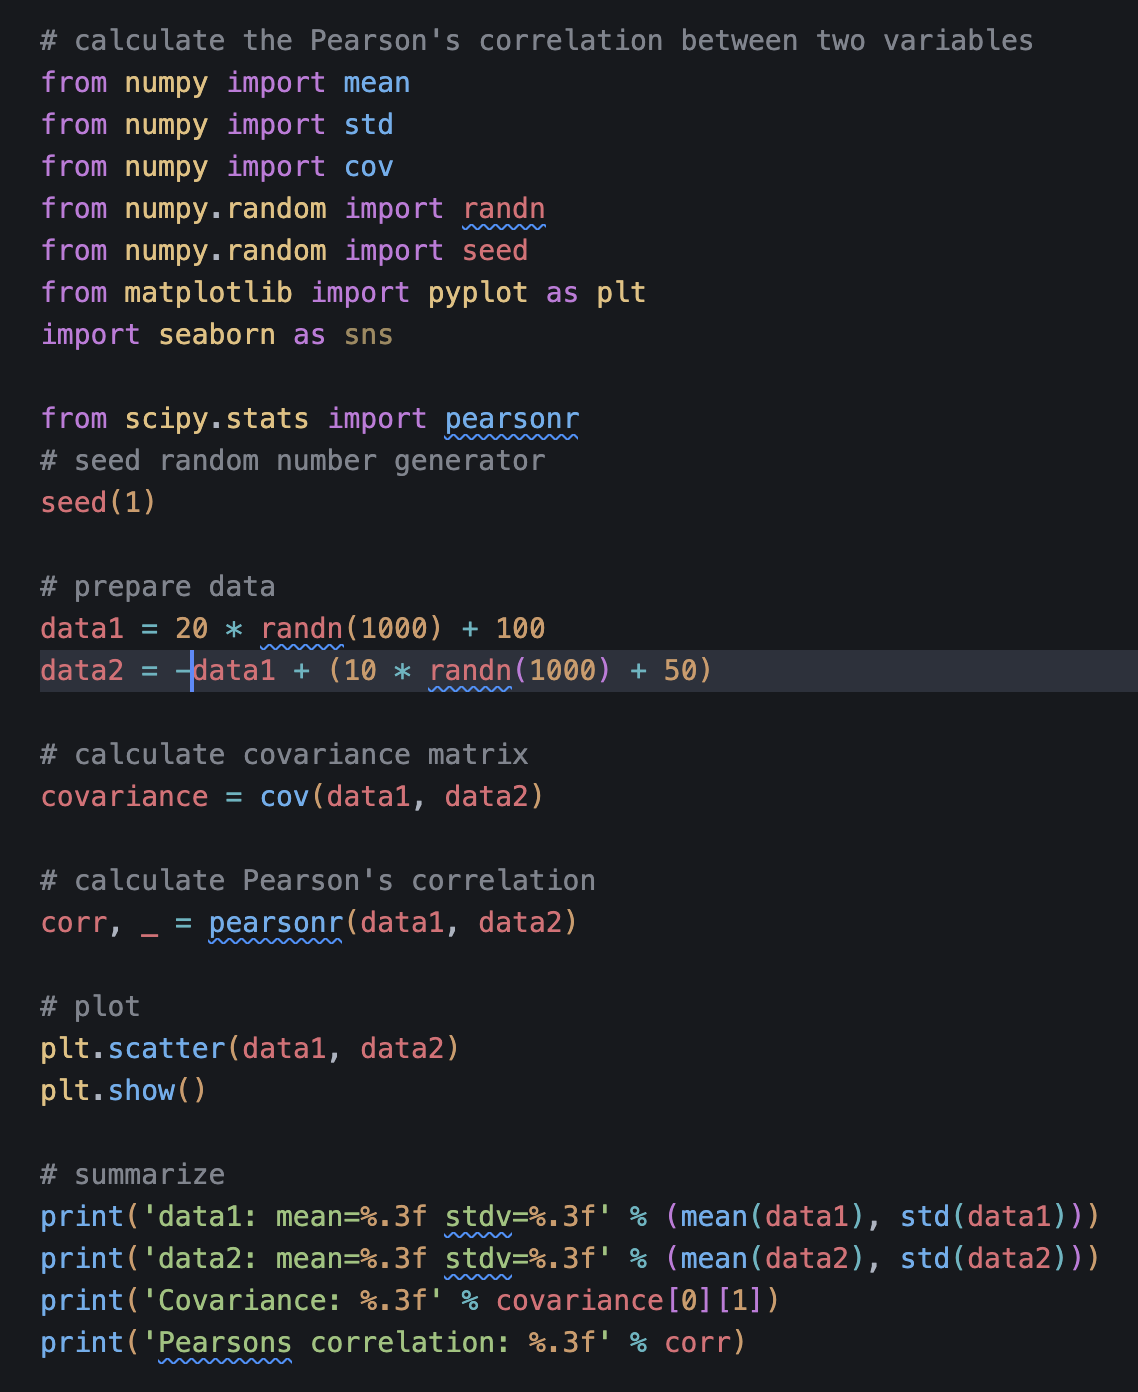
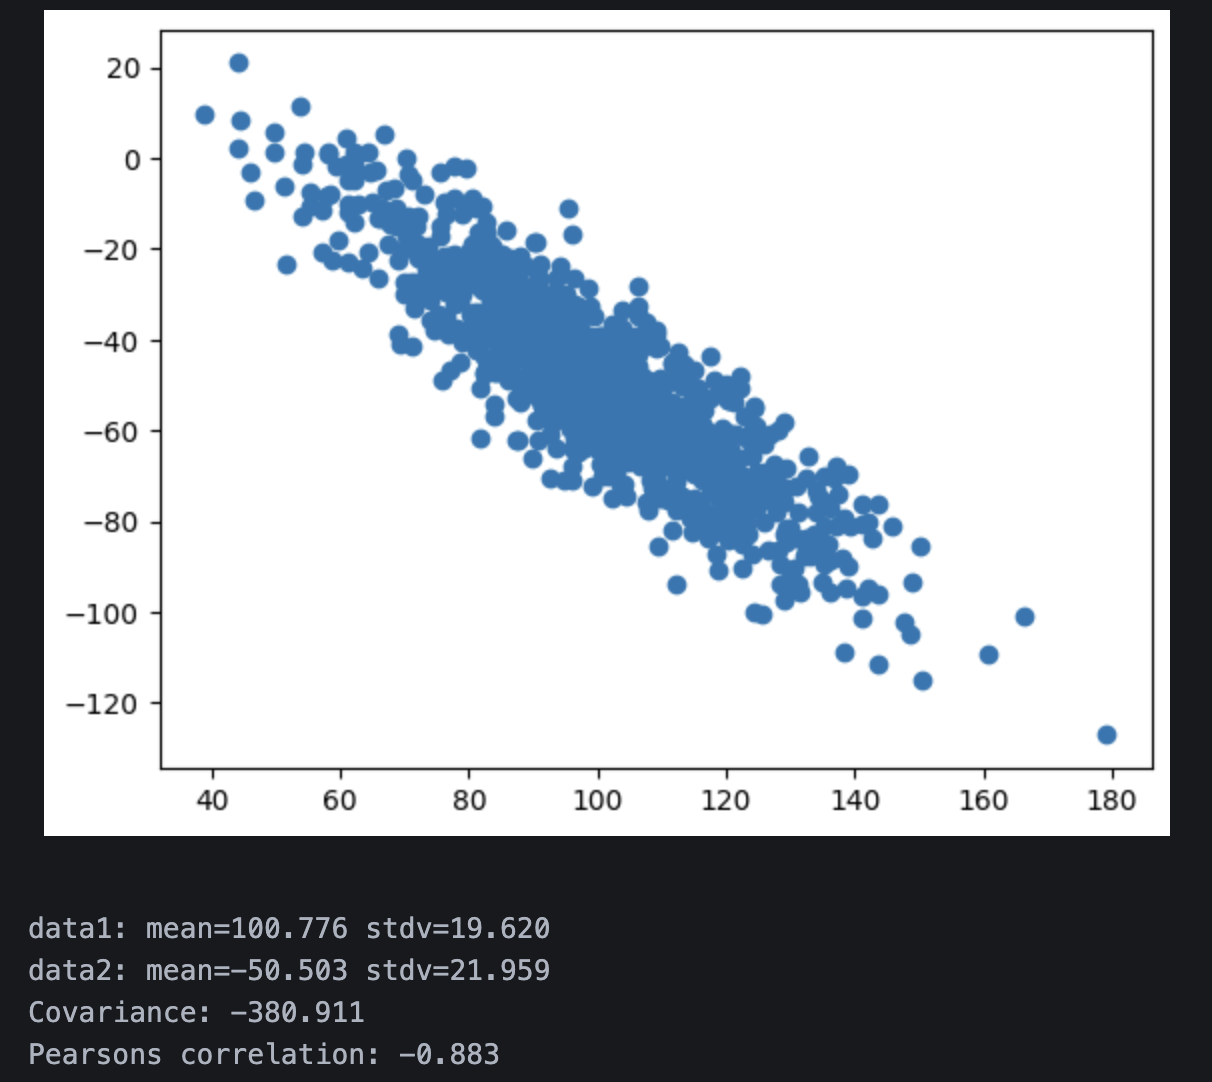
I have experimented by using the negative of data1 in order to invert the direction of the relationship. This change will lead to a strong negative Pearson correlation.
Linear Regression
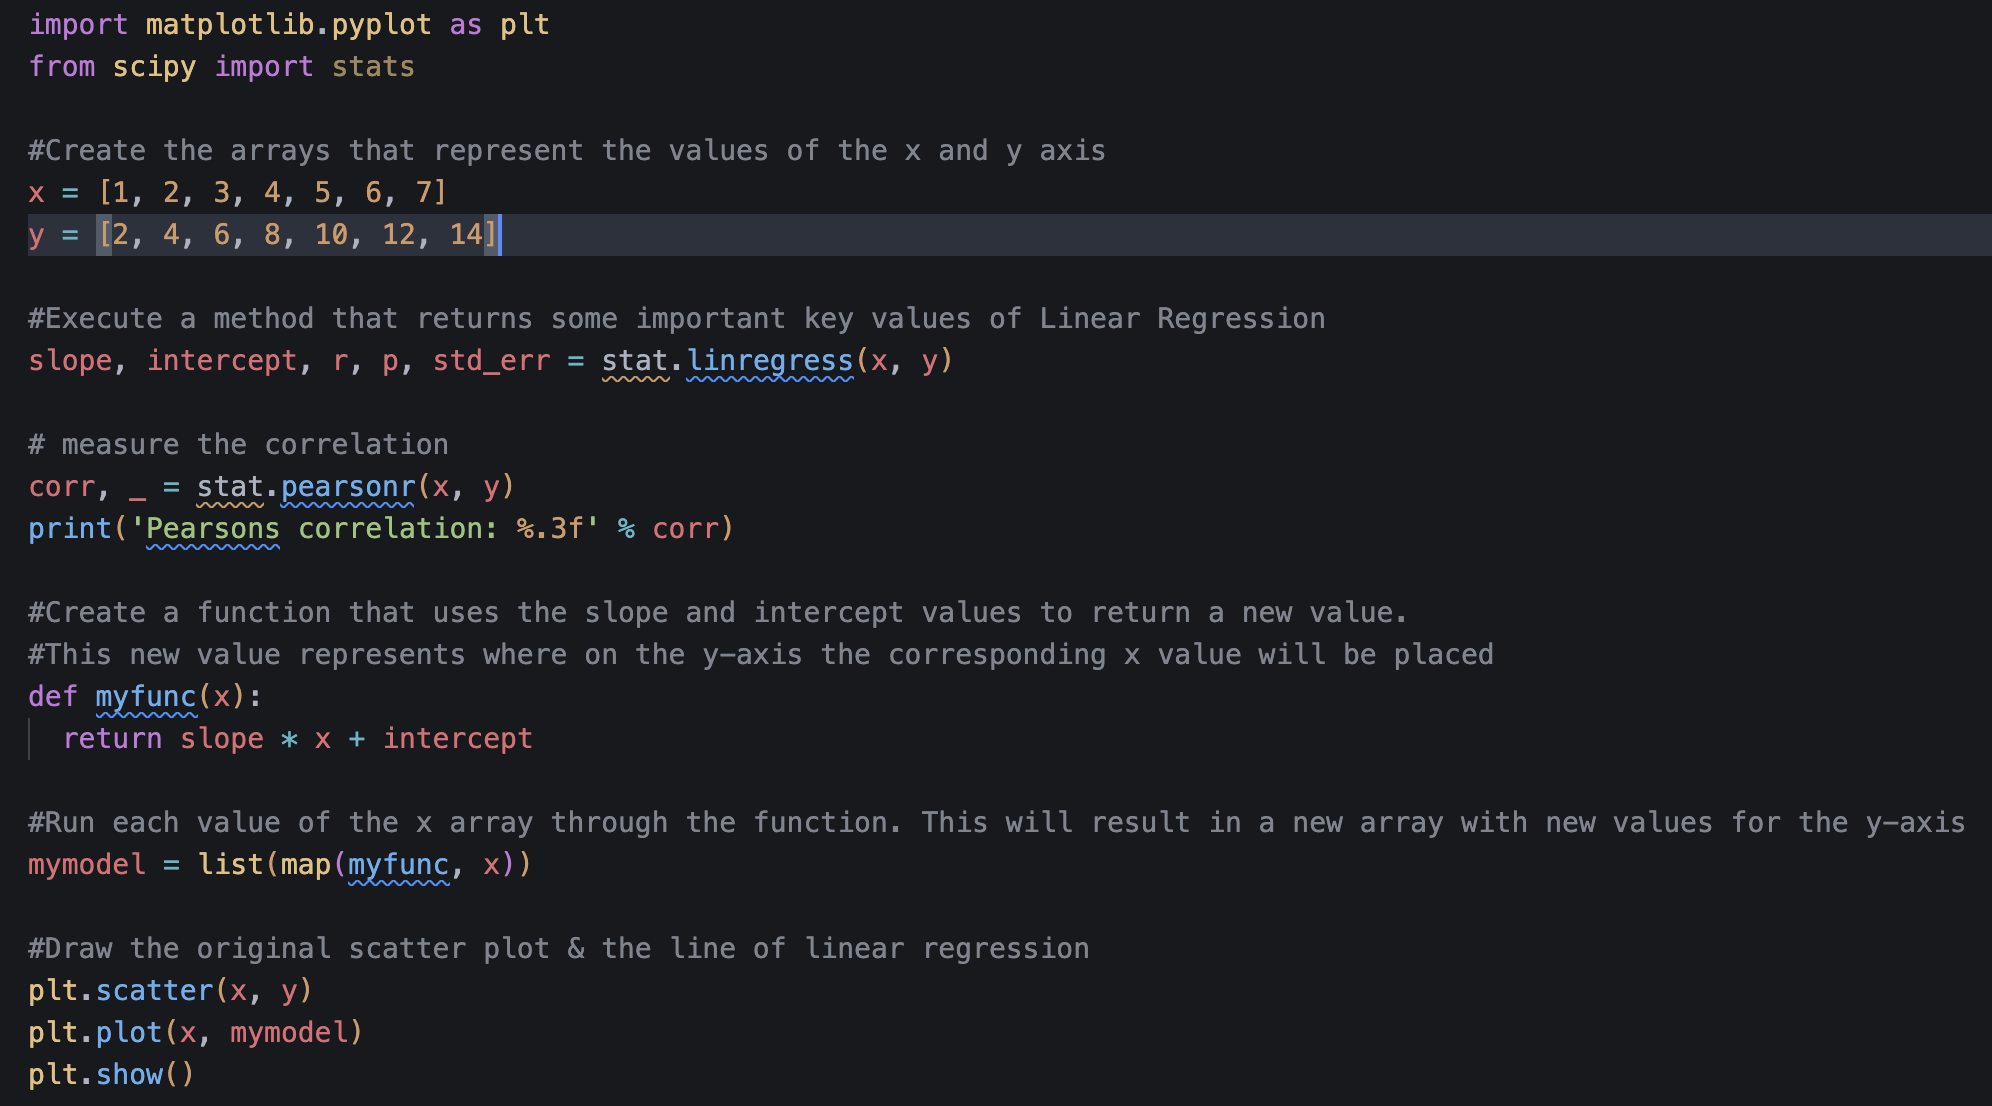
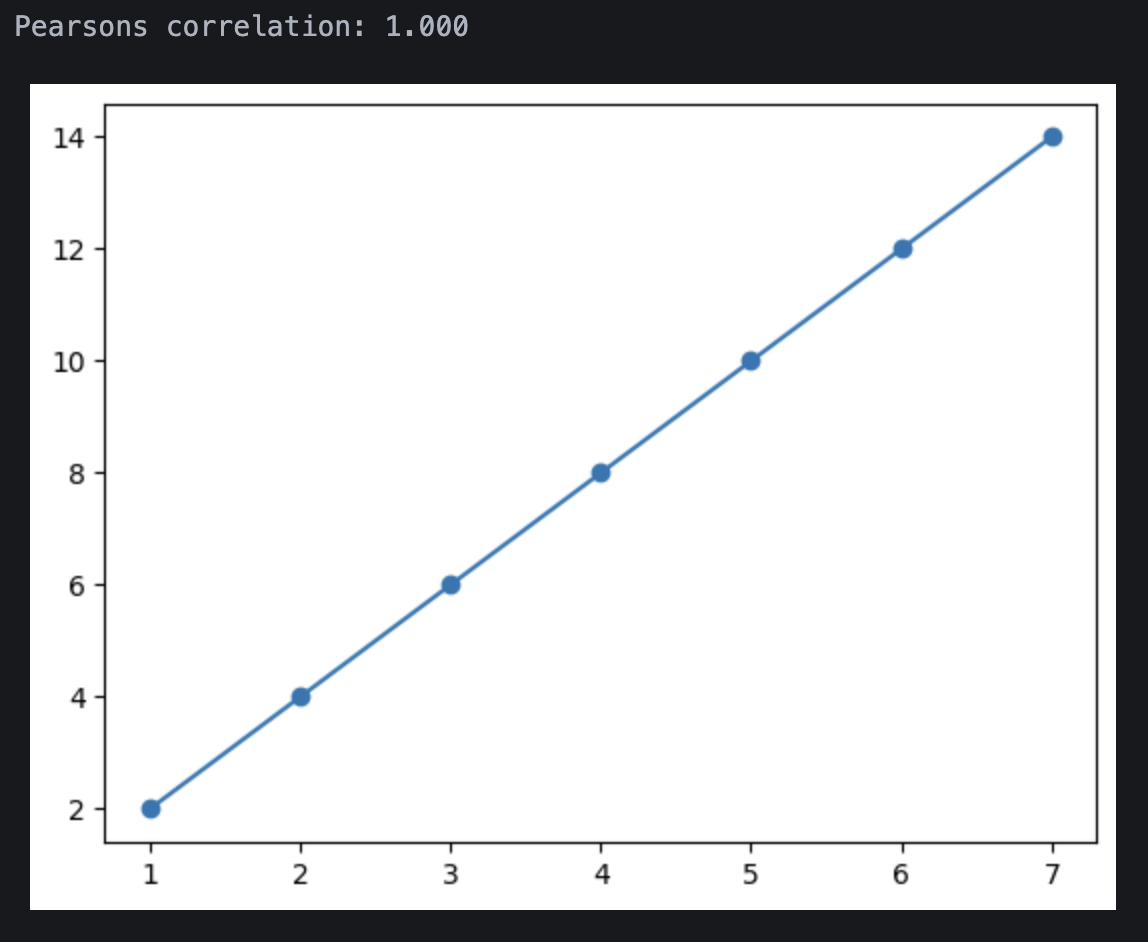
I have manipulated the x and y values in order to see how different relationships change and ultimately affect the regression line and correlation. By replacing x with a list of numbers that increase by 1 each step and y with twice the value for each corresponding x, I have resulted in an example of a perfect linear relationship.
Multiple Linear Regression
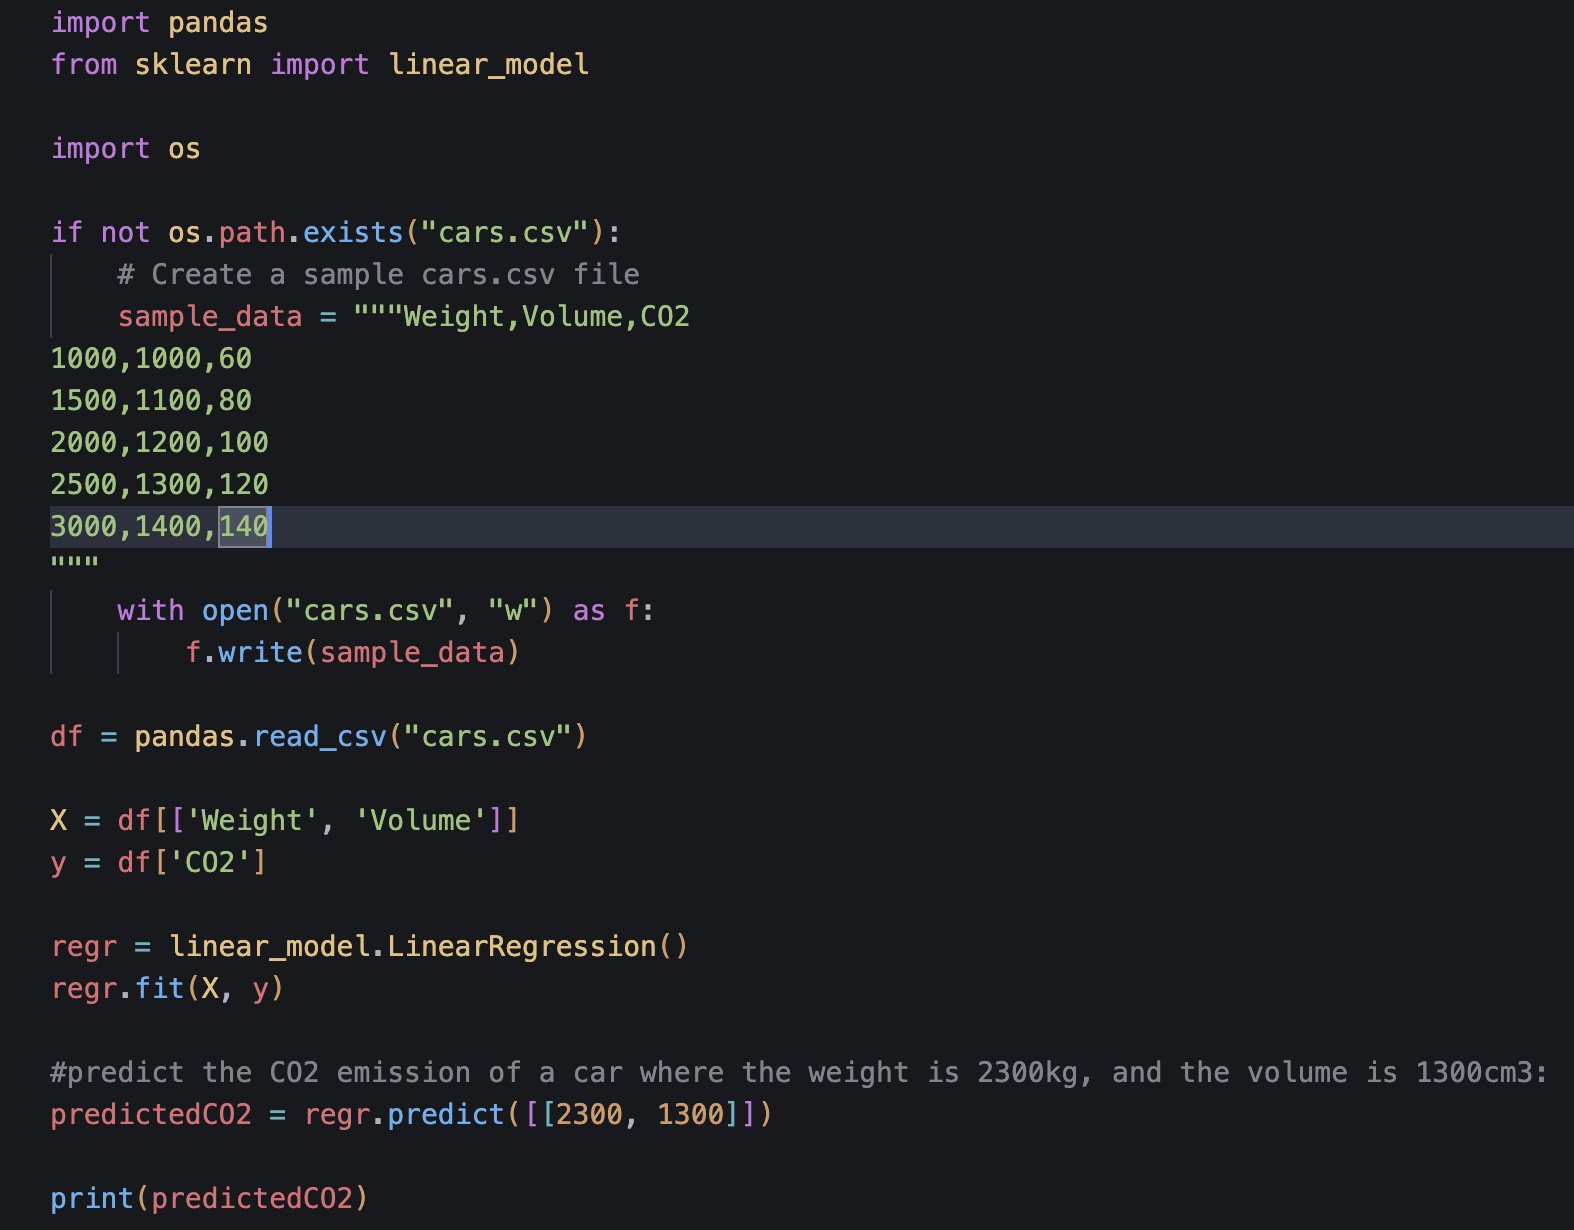
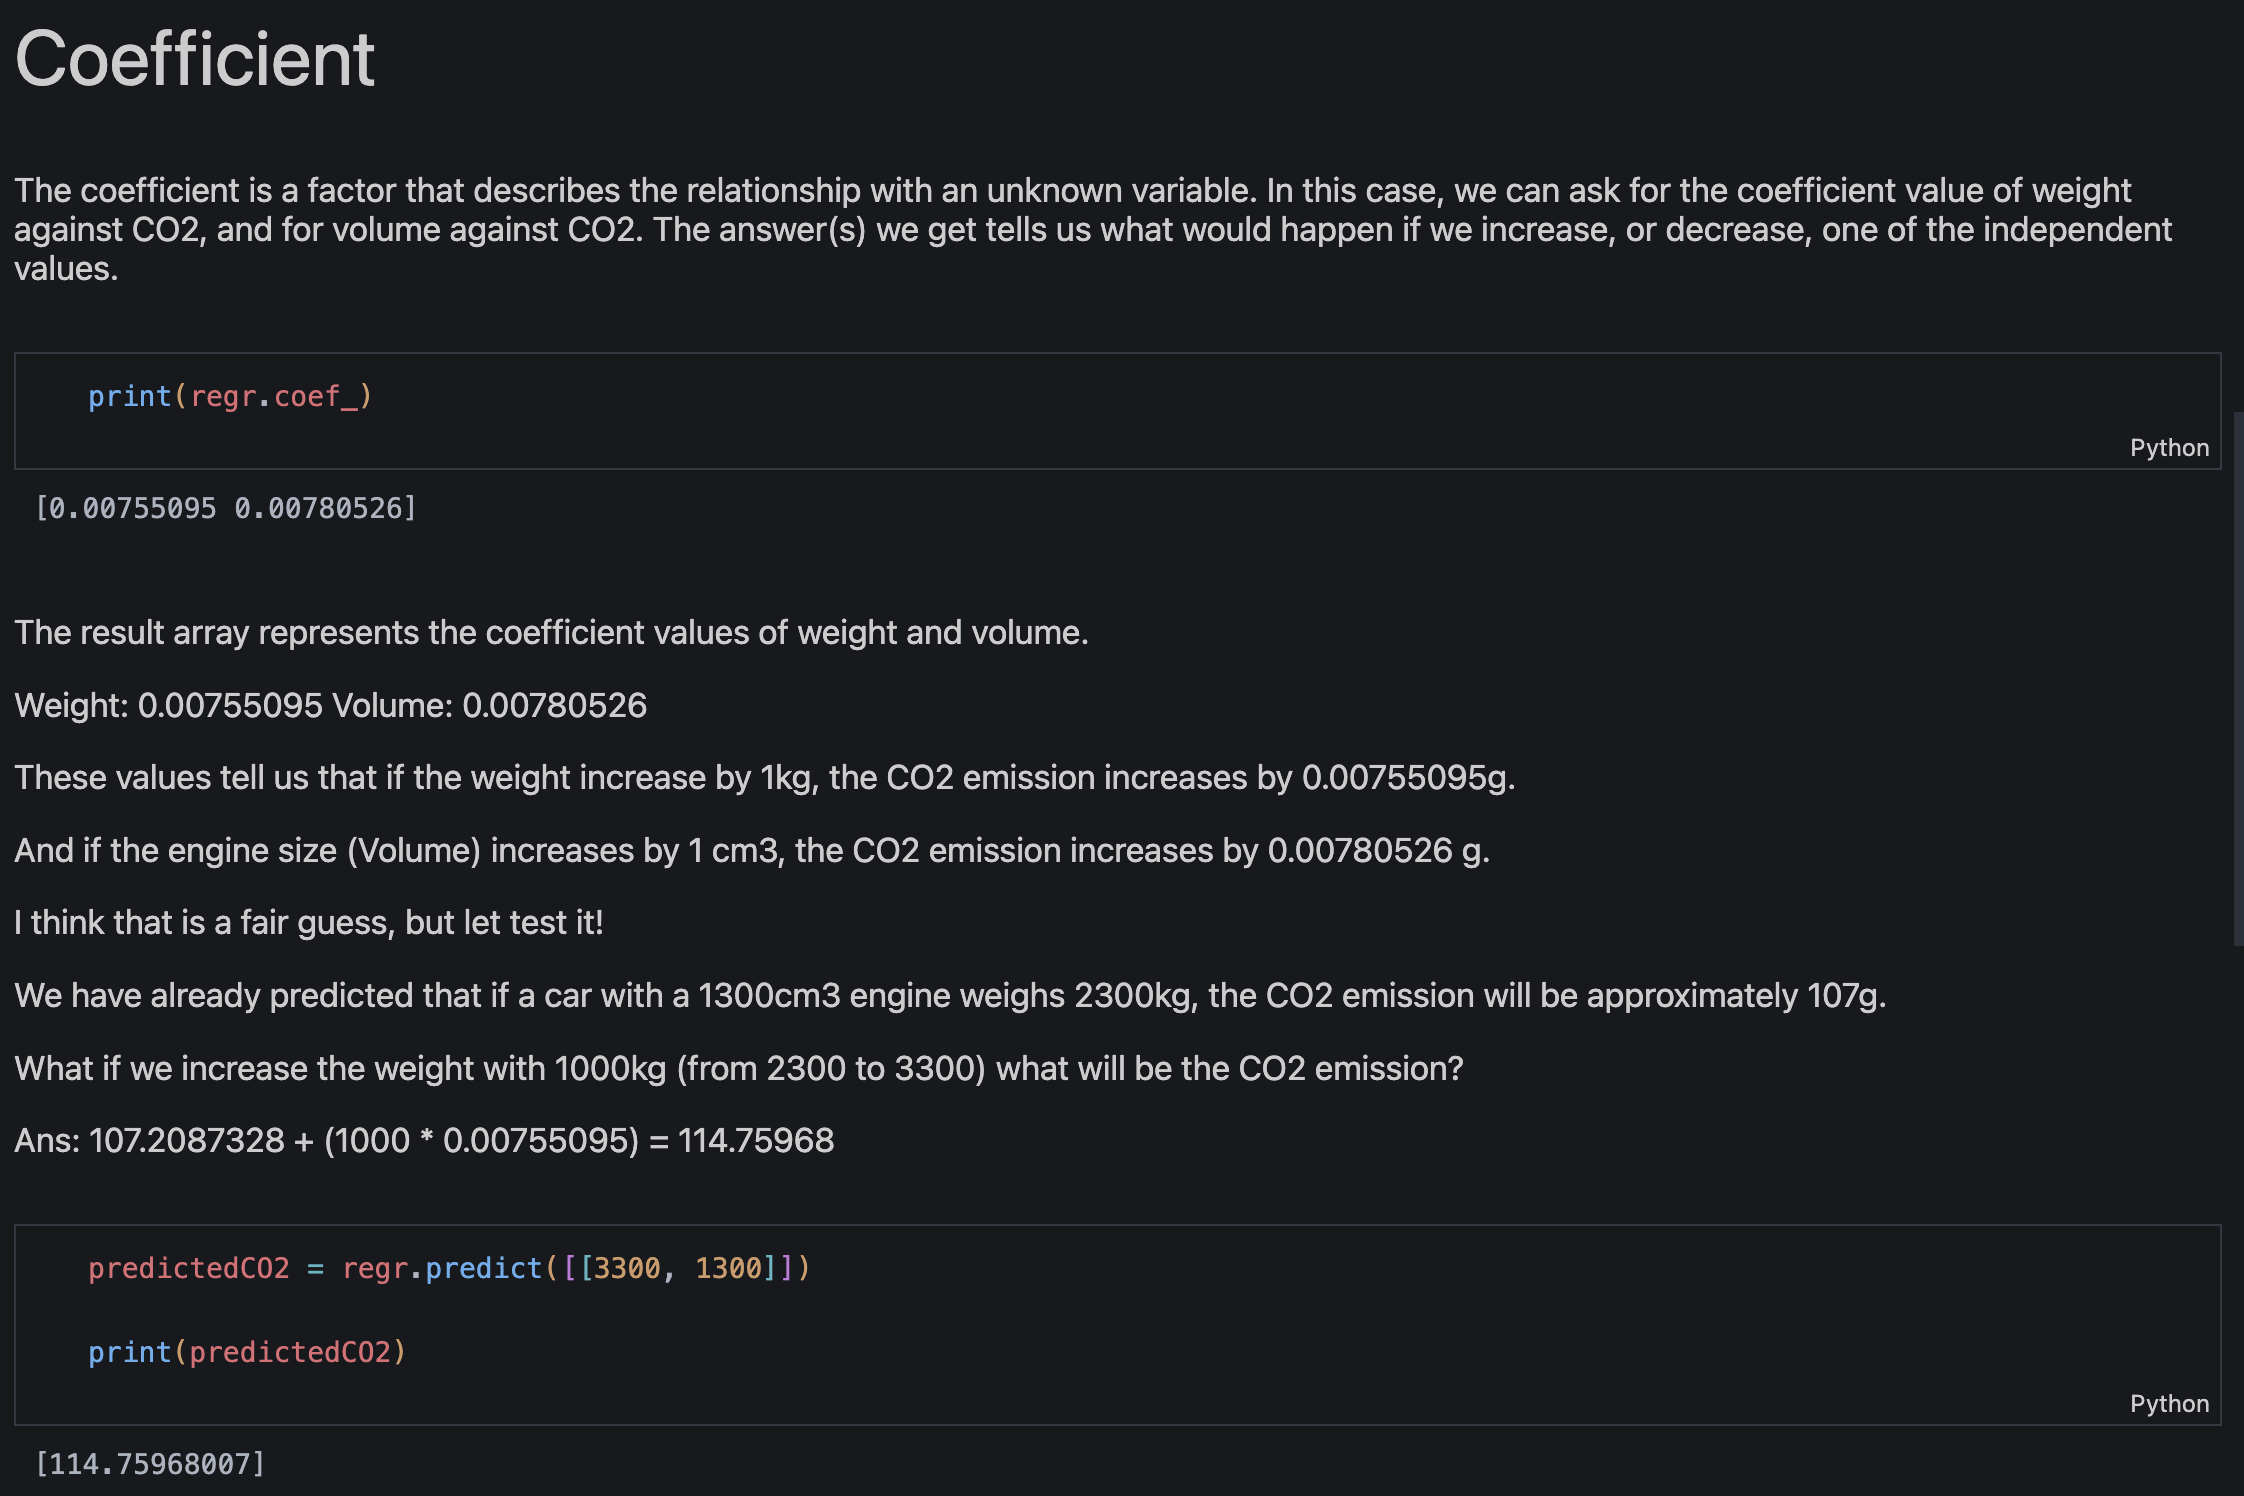
The following dataset includes three variables: Weight, Volume, and CO2 emissions. By adding a new set of values, I'm looking at how data directly impacts the regression coefficients. In this example, Weight and Volume increase proportionally with the CO2 level. The increases are proportional and consistent, implying a strong, linear, positive relationship between both Weight and CO2, and Volume and CO2.
Polynomial Regression
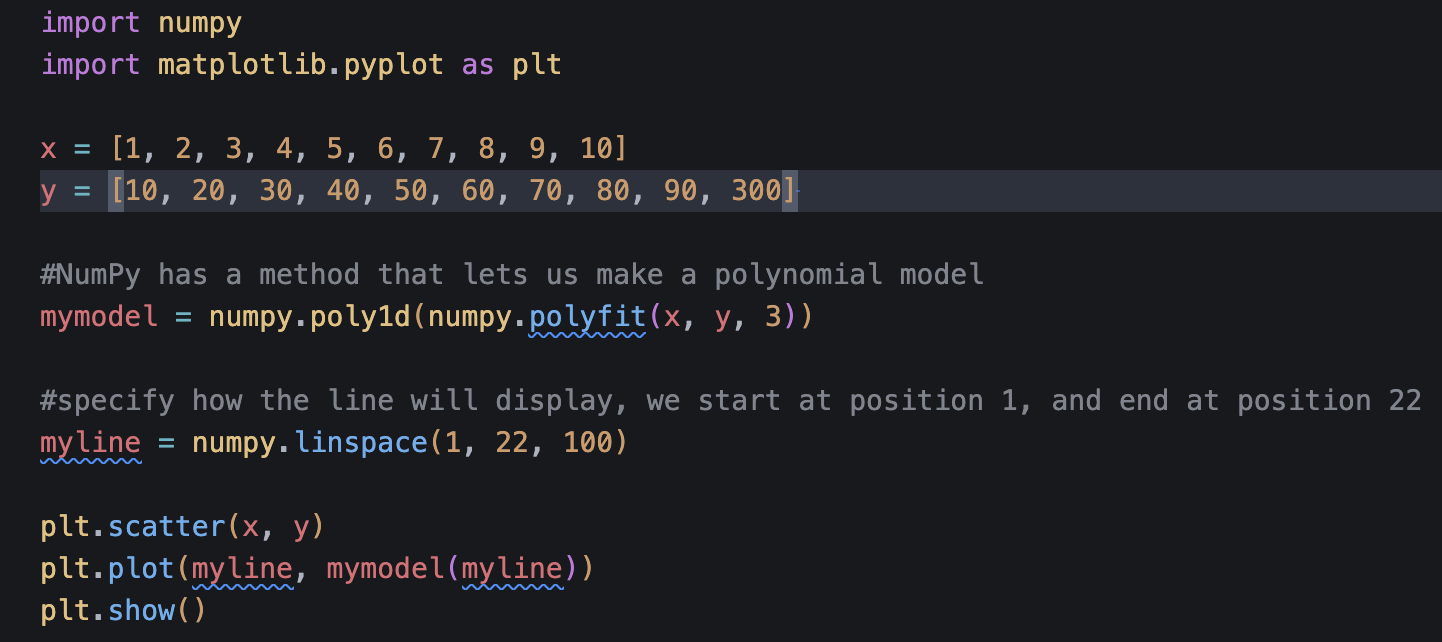
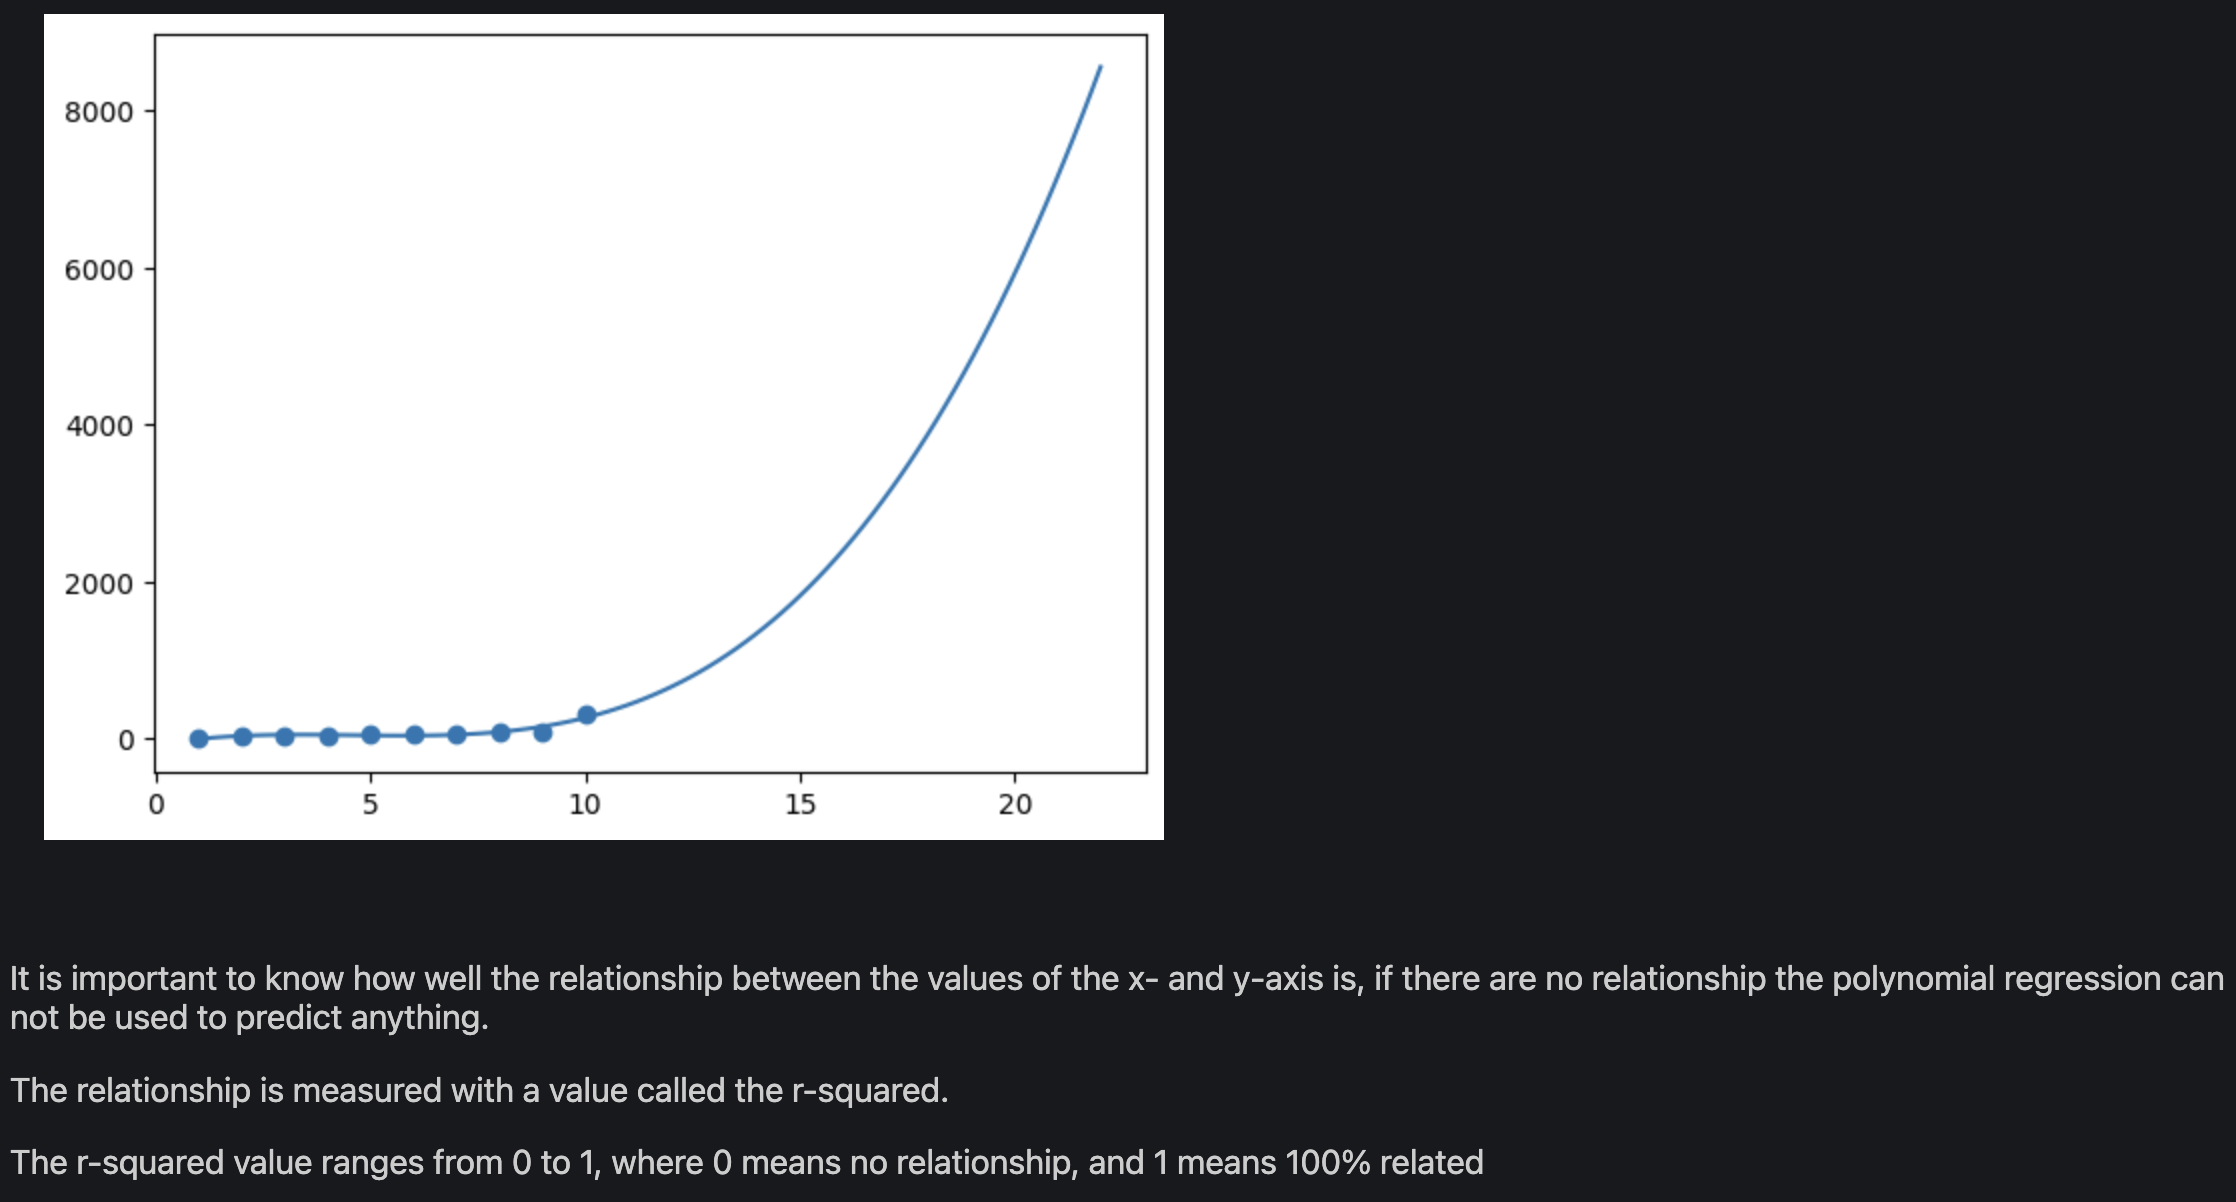
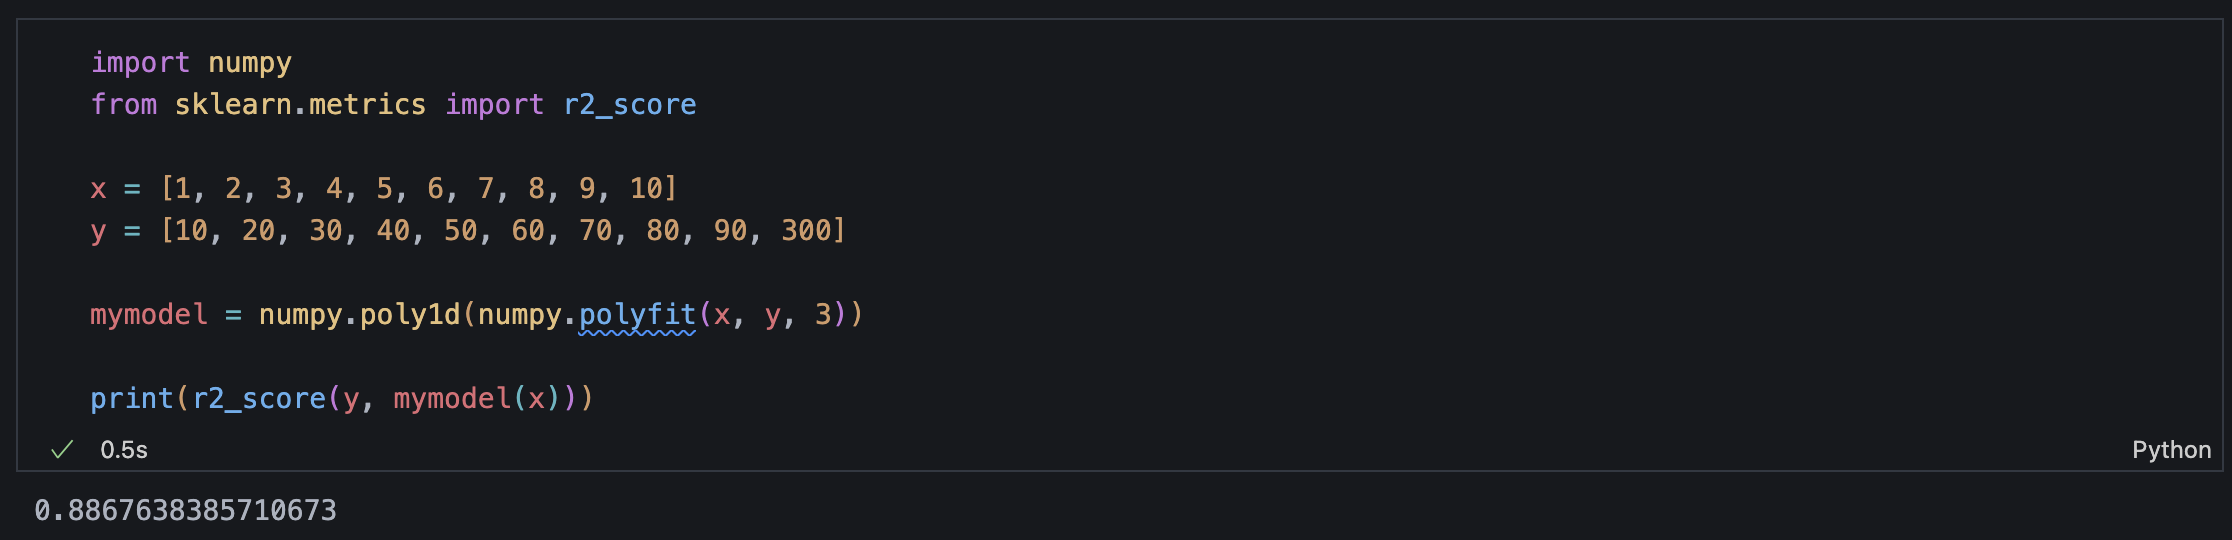
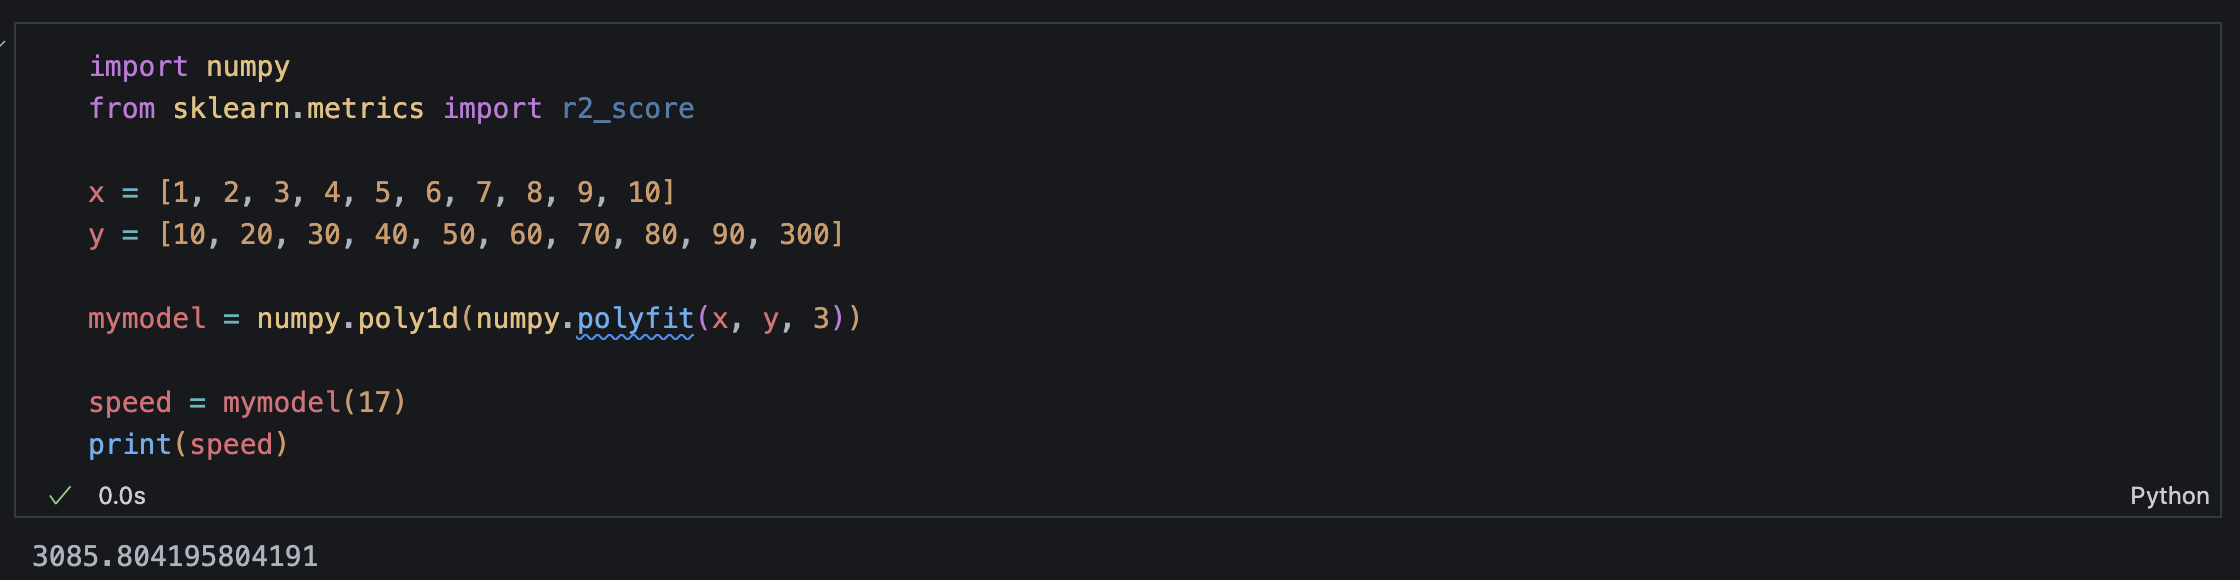
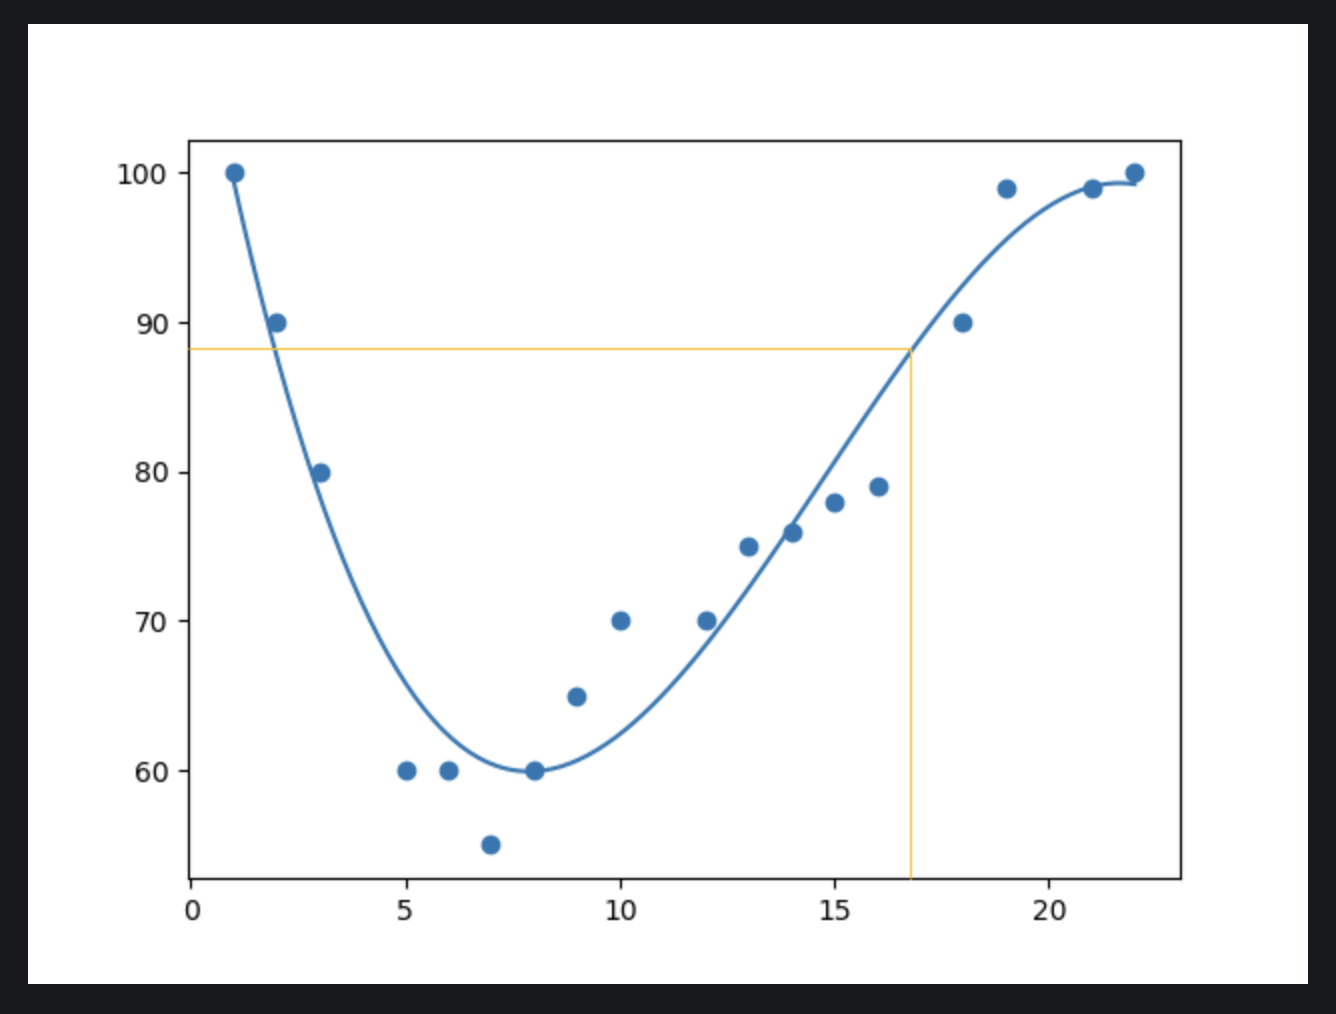
This example shows how a single outlier can cause severe distortion in a polynomial regression model. The dataset contains x values ranging from 1 to 10, as well as matching y values ranging from 10 to 90 until the last point, where y = 300 introduces a significant outlier. While the first 9 data points show a clear linear trend, the outlier at x = 10 leads the regression curve to bend dramatically upward near the end. This creates a skewed model that no longer adequately captures the overall pattern of the data.